Cloud & Infrastructure · Database Operations
Read Replicas and Replication Lag: What Breaks in Production
Adding read replicas is the standard fix for a database under read load, but it introduces a gap between when data is written and when it's readable everywhere. Here's what replication lag actually does to your application and how to design around it.

Shashikant Gupta
6 min read
Sponsored
Adding a read replica is usually the first move once a database’s read load starts crowding out its ability to serve writes quickly. It works, and it’s the standard scaling pattern for exactly that problem. What it also does, quietly, is introduce a gap between when a write is committed and when that write is visible everywhere else, and that gap is where a specific, recurring class of production bug lives.
What replication actually is
A primary-replica setup has one database (the primary) that accepts all writes, and one or more replicas that receive a continuous stream of changes from the primary and apply them to keep their own copy of the data current.
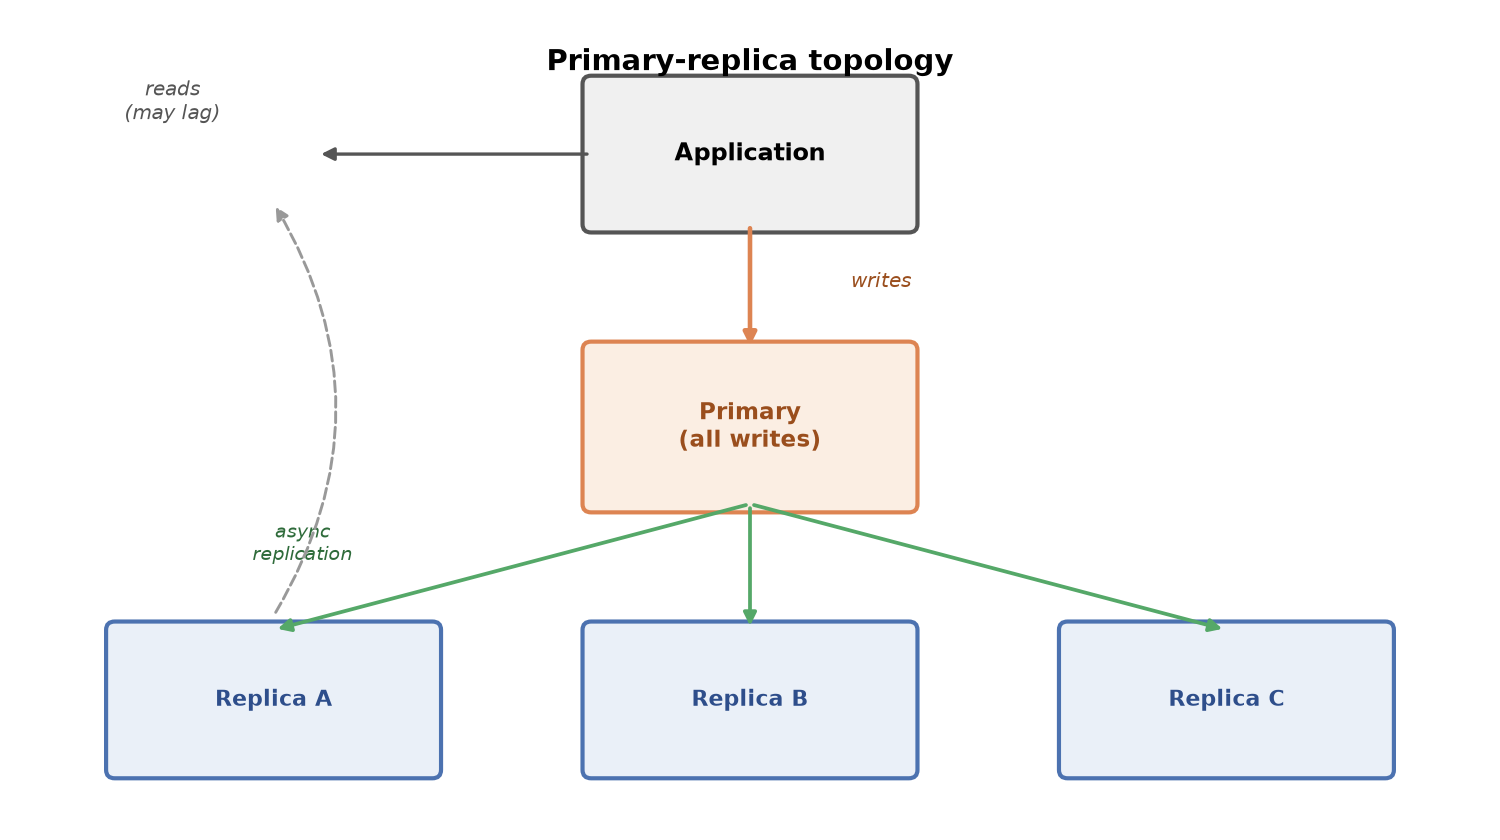
In the common case, that replication is asynchronous: the primary commits a write, returns success to the client, and separately streams the change to replicas, which apply it on their own schedule. That last part is the source of everything discussed below. The primary doesn’t wait for a replica to confirm it applied the change before telling the client the write succeeded. It can’t, without giving up the latency and availability benefits asynchronous replication exists to provide in the first place.
Primary commits write at t=0
Client receives "write successful" at t=0
Replica receives the change at t=0 + network delay
Replica applies the change at t=0 + network delay + apply time
                              ^
                    this whole gap is replication lag
The failure that actually shows up
The lag itself is usually small, single-digit to double-digit milliseconds under normal load. The problem isn’t the typical case, it’s that the lag is unbounded and situational, and the moment it matters is exactly the moment a user is watching.
The classic sequence:
- A user submits a form (updates a profile field, places an order, posts a comment). The write goes to the primary and succeeds.
- The application redirects the user to a page that displays that same data, and that page’s read query goes to a replica, because reads are routed to replicas by default to keep primary load down.
- The replica hasn’t caught up yet. The user sees the old value, or the new record missing entirely.
To the user, this looks exactly like data loss: “I just saved this and it’s gone.” The write actually succeeded. The read just happened to hit a replica that was, for a few hundred milliseconds, behind. This is one of the most common sources of “intermittent, can’t reproduce it” bug reports in systems that added read replicas without a consistency strategy to go with them.
The fix: read-your-writes, not fewer replicas
The answer isn’t to stop using replicas, it’s to route reads based on whether staleness is acceptable for that specific read, not apply a single global rule to every query.
// Naive: every read goes to a replica, including the one right after a write
async function updateProfile(userId, data) {
  await primaryDb.query('UPDATE users SET ... WHERE id = ?', [userId, data]);
  return replicaDb.query('SELECT * FROM users WHERE id = ?', [userId]); // may be stale
}

// Read-your-writes: reads that immediately follow this user's own write
// stay on the primary for a short window
async function updateProfile(userId, data) {
  await primaryDb.query('UPDATE users SET ... WHERE id = ?', [userId, data]);
  markRecentWrite(userId); // e.g. cache a flag with a few seconds' TTL
  return primaryDb.query('SELECT * FROM users WHERE id = ?', [userId]);
}

async function getProfile(userId) {
  const db = hasRecentWrite(userId) ? primaryDb : replicaDb;
  return db.query('SELECT * FROM users WHERE id = ?', [userId]);
}
This is the read-your-writes consistency guarantee: a user always sees the effect of their own write, even though other users viewing the same data might briefly see a slightly stale version from a replica. It’s a narrower, cheaper guarantee than “every read everywhere is always fully consistent,” and it’s the one that actually matches what users notice and complain about.
Some frameworks build a version of this in already; a common pattern is “stickiness,” where a session is pinned to the primary for a short window after any write it performs, then falls back to normal replica routing. If your ORM or data layer doesn’t support this natively, the flag-based approach above works in application code.
Deciding what goes where
| Read type | Route to | Why |
|---|---|---|
| Data the current user just wrote | Primary (or a confirmed-caught-up replica) | Read-your-writes; staleness here reads as a bug |
| An admin actively debugging live state | Primary | Staleness undermines the entire point of looking |
| Public content listings, feeds, dashboards | Replica | Users have no baseline for “how fresh should this be” |
| Analytics and reporting queries | Replica (often a dedicated one) | Long-running and can tolerate real staleness; isolates load from user-facing replicas |
A useful pattern for the last row: a dedicated replica just for analytics and reporting workloads, separate from the ones serving user-facing reads. Long-running aggregate queries are exactly the kind of load that can itself cause a replica to fall behind, and isolating that load means an expensive report doesn’t degrade the read replica ordinary users are hitting.
Monitoring the thing you’re relying on
Every major database surfaces a replication lag metric: PostgreSQL through pg_stat_replication, MySQL through Seconds_Behind_Master (or Seconds_Behind_Source on newer versions), and managed services like Amazon RDS, Cloud SQL, and Aurora expose it directly as a dashboard metric. This deserves the same alerting treatment as any other production health signal. A replica whose lag is normally under 50ms and climbs into multi-second territory is telling you something concrete: it’s under-provisioned for current read load, or a long-running write on the primary is backing up the replication stream. Catching that before it produces a wave of “my data disappeared” support tickets is exactly what the metric is for.
Replication lag isn’t a bug in your setup, it’s an inherent property of asynchronous replication that every system using read replicas has to design around explicitly. The teams that get bitten by it are the ones who added replicas purely for connection pooling and read scaling without treating consistency as a separate design decision. Route by read type, implement read-your-writes for the cases where staleness is visible to the user who caused it, and monitor lag as a first-class production signal rather than an implementation detail you only think about after something breaks.
Frequently asked questions
- What causes replication lag?
- In asynchronous replication, the primary commits a write and returns success to the client before confirming the replica has applied it. The replica receives the write (as a binlog entry, WAL segment, or equivalent depending on the database) and applies it independently, on its own schedule. The gap between the primary's commit and the replica's apply is replication lag. It's normally small, milliseconds, but it grows under specific conditions: the replica is under heavy read load and can't keep up with incoming replication traffic, a single large write (a bulk update or schema migration) takes a while to apply, or network latency between primary and replica increases.
- What's the actual user-facing symptom of replication lag?
- The most common one: a user performs a write (updates their profile, posts a comment) and is immediately shown a page that reads that same data back from a replica that hasn't caught up yet. The user sees their own change missing, or an older version of it, for however long the lag lasts. This reads as a bug to the user ("I just changed this and it didn't save") even though the write actually succeeded and will show up once replication catches up, usually within a second or two.
- What is read-your-writes consistency and how do I implement it?
- It's a guarantee that a user always sees the effects of their own writes, even if other users might see a slightly stale view from a replica. The standard implementation: route reads that immediately follow a write by the same user to the primary (or to a replica confirmed to be caught up), for some short window after the write, then fall back to normal replica routing after that window passes. Some frameworks and ORMs support this as session-level 'stickiness' to the primary right after a write; others require you to route explicitly in application code.
- Should I route every read to a replica to reduce load on the primary?
- No. Route by whether a given read can tolerate staleness, not by a blanket rule. Reads that must reflect the absolute latest state (checking your own just-submitted order, an admin dashboard someone is actively debugging with) belong on the primary. Reads that can tolerate a few hundred milliseconds of staleness (a public product listing, an activity feed, most dashboard views) are good replica candidates. Treating 'send it to a replica' as a blanket toggle is exactly what produces the read-your-writes bugs users report as data loss.
- How do I monitor replication lag in production?
- Every major database exposes a lag metric: PostgreSQL has replication delay queryable via pg_stat_replication, MySQL exposes Seconds_Behind_Master (or Seconds_Behind_Source in newer versions), and managed services (RDS, Cloud SQL, Aurora) surface a ReplicaLag metric directly in their monitoring dashboards. Alert on it the same way you'd alert on any other production health signal, a lag that's usually under 50ms and suddenly climbs into seconds is telling you something, often that a replica is under-provisioned for its read load or that a long-running write is blocking replication apply.
Sponsored
More from this category
More from Cloud & Infrastructure
 R.01
R.01 The AWS CloudFront Outage That Took Down Canvas, Blackboard, and Hugging Face at Once
 R.02
R.02 Kubernetes 1.36 Haru: What's Actually Worth Upgrading For
 R.03
R.03 AWS's Trillion-Dollar Billing Bug Is a Warning About Automated Cost Alerts
Sponsored
Discussion
Join the conversation.
Comments are powered by GitHub Discussions. Sign in with your GitHub account to leave a comment.
Sponsored