Business · Analytics
A/B Testing Significance: How Long to Run a Test
Calculate sample size before you start, from your baseline rate and the smallest effect worth detecting, then run to it. Stopping early gives you noise.

Shashikant Gupta
5 min read
Sponsored
If you’re running an A/B test and asking “has it been long enough yet,” the honest answer is that you’re asking the wrong question. The right one is “have I hit the sample size I calculated before I started,” and if you didn’t calculate one before starting, that’s the problem to fix first, not the calendar.
Why watching the p-value doesn’t work
The instinct to check a test daily and stop the moment the result looks significant is understandable and it’s also the single most common way A/B test results turn out to be noise. A p-value below 0.05 calculated once, after a pre-committed sample size, has a genuine 5% false-positive rate. A p-value checked daily over three weeks, where you stop and declare a winner the first time it crosses 0.05, does not have a 5% false-positive rate. Every additional look gives random variation another chance to cross the threshold purely by luck, and the cumulative effect can push your real false-positive rate above 20%, four times higher than the number on the dashboard implies.
This is called peeking, and the fix isn’t “don’t look at the data.” It’s deciding your stopping rule before the test starts: either a fixed sample size calculated in advance, or a sequential testing method (like a sequential probability ratio test) specifically designed to let you check early without inflating your error rate.
The three numbers you need before you start
Required sample size isn’t a guess, it’s a calculation from three inputs you have to commit to before the test begins:
- Baseline conversion rate. What’s your current rate on the metric you’re testing? This has to come from real historical data, not an estimate.
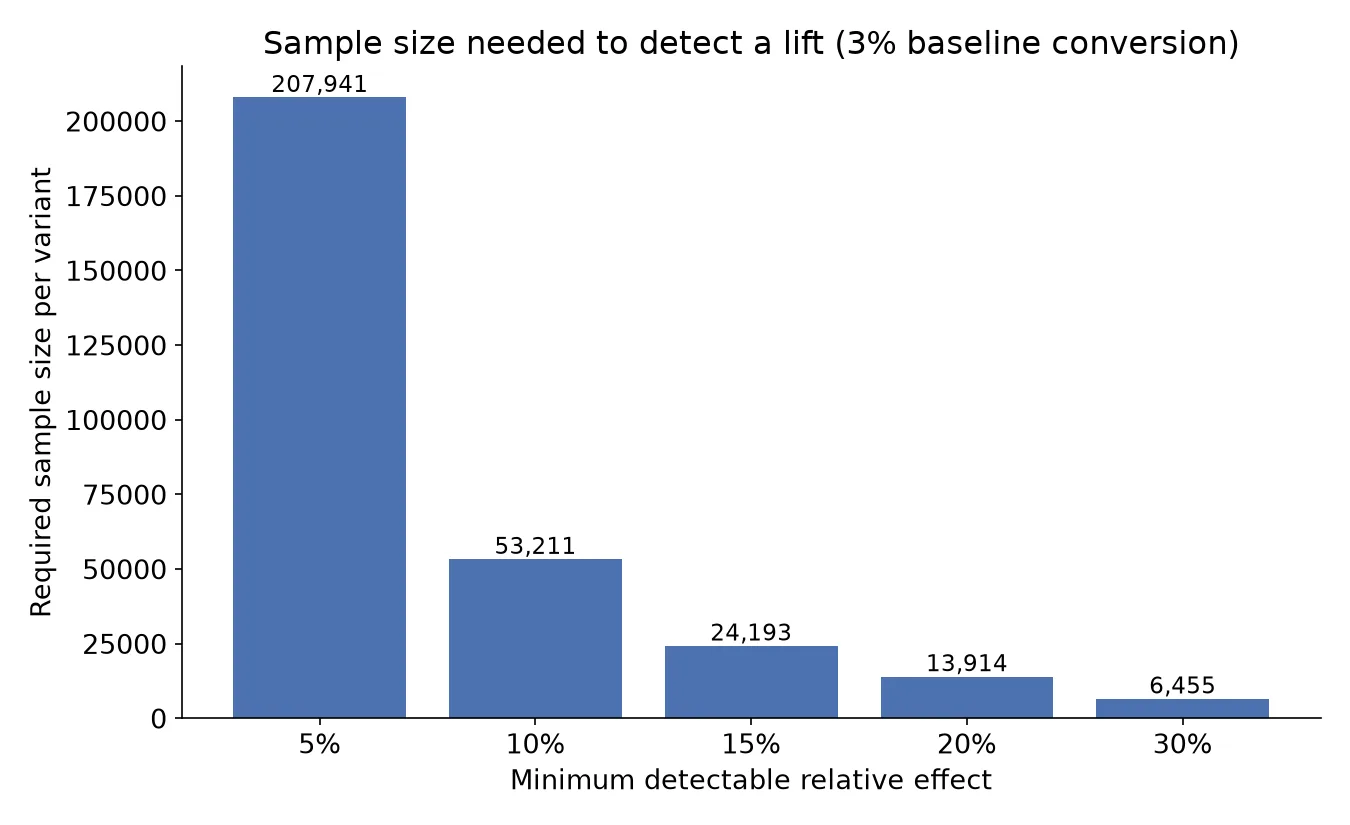
- Minimum detectable effect. The smallest relative lift that would actually matter to the business if it’s real. This is a judgment call, and it has an outsized effect on your required sample: detecting a 20% relative lift off a given baseline needs a fraction of the traffic that detecting a 5% relative lift needs, often close to an order of magnitude less.
- Significance level and power. Conventionally 5% significance (a 5% chance of a false positive if there’s really no effect) and 80% power (an 80% chance of detecting the effect if it’s really there). Lowering these thresholds does reduce your required sample size, and it also means accepting a higher chance of getting the wrong answer.
A simplified version of the standard two-proportion sample size formula, for a rough estimate per variant:
import math

def required_sample_size(baseline_rate, minimum_detectable_effect, alpha=0.05, power=0.80):
    p1 = baseline_rate
    p2 = baseline_rate * (1 + minimum_detectable_effect)
    p_pooled = (p1 + p2) / 2

    z_alpha = 1.96   # two-tailed, alpha = 0.05
    z_power = 0.8416  # power = 0.80

    numerator = (z_alpha * math.sqrt(2 * p_pooled * (1 - p_pooled)) +
                 z_power * math.sqrt(p1 * (1 - p1) + p2 * (1 - p2))) ** 2
    denominator = (p2 - p1) ** 2

    return math.ceil(numerator / denominator)

# Baseline 3% conversion, want to detect a 10% relative lift
print(required_sample_size(0.03, 0.10))  # sample size needed per variant
Most product analytics tools (PostHog, Amplitude, Optimizely) have a built-in calculator that does this for you; the point of running the formula by hand once is understanding why the number comes out the way it does, so a stakeholder asking “can we just check tomorrow” gets a real answer instead of a shrug.
Significant is not the same as worth shipping
A result can be statistically significant and still not matter. Given enough traffic, a genuinely real 0.3% relative lift in conversion will eventually cross a significance threshold, and shipping it might add a permanent second code path, a config flag to maintain, and a subtle interaction risk with the next feature built on top of it, all for an effect too small to move any number a stakeholder actually tracks. Deciding your minimum detectable effect before the test isn’t just a statistics requirement, it’s the number that keeps a technically-real-but-trivial result from getting treated as a win.
The metric-multiplication trap
Testing one metric at a 5% significance threshold gives you roughly a 5% false-positive rate. Testing five metrics at that same threshold, and calling the test a win if any one of them comes back significant, gives you closer to a 23% chance that at least one is a false positive purely by chance, since each additional comparison is another roll of the dice. Pick a single primary metric before the test starts. Track anything else as secondary and directional, not as a second chance to declare victory, or apply an explicit correction like the Bonferroni adjustment if you genuinely need to evaluate several metrics with the same rigor.
None of this requires a statistics degree to apply correctly, it requires deciding the sample size, the primary metric, and the stopping rule before the test starts, and then actually holding to that decision when the results start trickling in and someone wants to call it early. That discipline is the entire difference between a result you can trust and a number that happened to look good the day someone checked. If your team is building out a testing and analytics practice and wants a second look at how experiments are currently being run and reported, that’s a conversation worth having with our team before the next test launches, not after a shipped “win” turns out not to replicate.
Frequently asked questions
- How long should an A/B test run before I trust the result?
- Until it reaches the sample size you calculated before starting, based on your baseline conversion rate, the minimum effect size you care about detecting, and your desired significance level and power. There's no universal answer in days or weeks; a high-traffic checkout page might hit its required sample in three days, while a low-traffic feature might need six weeks. The number of days is a consequence of your traffic and your calculated sample size, not something to guess at directly.
- Why is it wrong to stop a test as soon as the result looks significant?
- Because a p-value calculated repeatedly as data comes in doesn't mean what a single p-value calculated once means. Each time you check and could choose to stop, you're giving random noise another chance to look significant. This is called peeking, and with daily checks over a few weeks, it can push your real false-positive rate well past the 5% you think you signed up for, sometimes above 20%. If you want to check results early without this problem, you need a sequential testing method designed for it, not repeated standard significance tests.
- What's the difference between statistical significance and a result worth shipping?
- Statistical significance tells you the observed difference is unlikely to be pure chance, nothing more. With enough traffic, even a genuinely tiny effect, a 0.3% relative lift in conversion, can reach statistical significance. Whether that's worth shipping depends on the cost of maintaining the change, whether it interacts badly with other features, and whether the effect size clears a bar that matters to the business. Decide your minimum meaningful effect size before the test, not after seeing a significant-but-small result and deciding it counts.
- Does testing multiple metrics at once change how I should interpret the results?
- Yes, and this trips up more teams than peeking does. If you test five metrics at a 5% significance threshold each, the probability that at least one shows a false positive by chance alone is roughly 23%, not 5%. Pick one primary metric before the test starts and treat everything else as secondary, directional information, or apply a correction like the Bonferroni method that adjusts your significance threshold for the number of comparisons you're actually making.
Sponsored
Sponsored
Discussion
Join the conversation.
Comments are powered by GitHub Discussions. Sign in with your GitHub account to leave a comment.
Sponsored