Cloud & Infrastructure · Observability
Distributed Tracing Explained: Following a Request Across Every Service It Touches
A single checkout request might touch five services and nobody can say which one is slow. Distributed tracing fixes that by tagging every hop with one trace ID. Here's how spans, trace IDs, and context propagation actually work, with OpenTelemetry examples.

Prathviraj Singh
5 min read
Sponsored
A checkout request touches five services and takes 420 milliseconds longer than it should. Which one is slow? Logs from each service show normal-looking entries. Metrics show nothing alarming, average latency per service is fine. The problem only exists in the specific combination of calls this one request happened to make, and no single service’s logs or dashboards can show you that combination. This is exactly the gap distributed tracing closes.
What a trace actually is
A trace is the complete path one request takes through a system, identified by a single trace ID generated the moment the request enters. Every unit of work along that path, an HTTP call, a database query, a cache lookup, gets recorded as a span: a record with a name, a start time, a duration, and a parent span ID pointing back to whichever span caused it to happen.
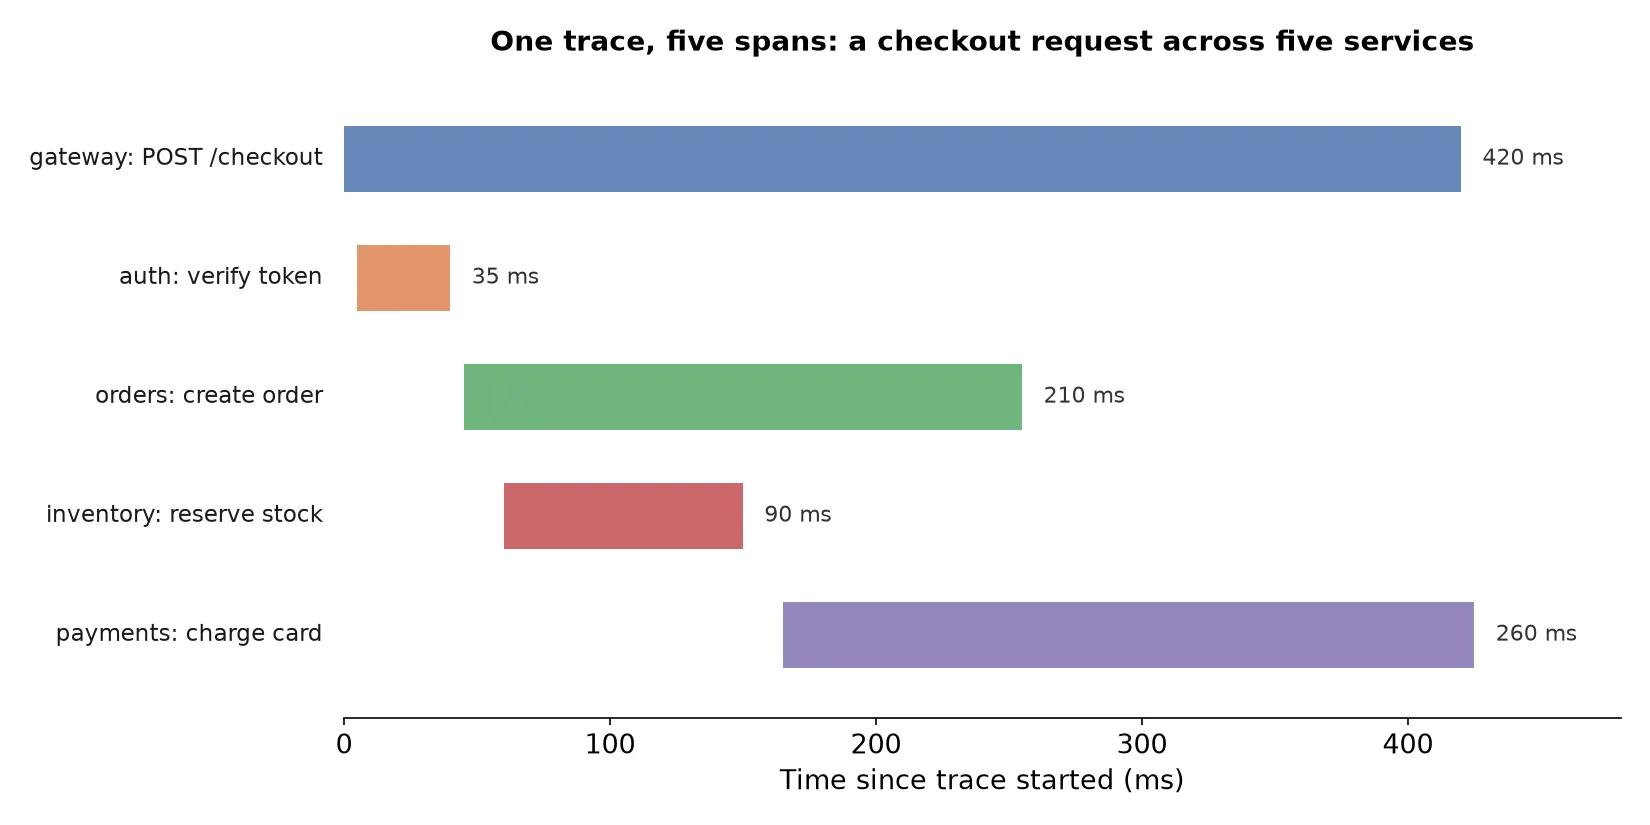
Read left to right, that waterfall answers the question directly: the gateway’s total request time is 420ms, but payments: charge card alone accounts for 260ms of it, starting at the 165ms mark, well after orders: create order returns. No log-grepping across five services required. The trace already has the answer laid out on one timeline.
Spans, and how they connect
Each span carries, at minimum:
{
  "trace_id": "4bf92f3577b34da6a3ce929d0e0e4736",
  "span_id": "00f067aa0ba902b7",
  "parent_span_id": "b7ad6b7169203331",
  "name": "orders: create order",
  "start_time": "2026-08-08T14:02:11.045Z",
  "duration_ms": 210
}
The trace_id is shared across every span in the request. The parent_span_id is what turns a flat list of spans into a tree: it says “this span happened because that other span called it.” A tracing backend uses that parent-child structure to render the waterfall, and to compute derived views like which service accounts for the most total time across many traces, not just one.
The part that requires actual code: context propagation
Generating a span inside one service is the easy part; most tracing SDKs do it automatically for common frameworks. The part that requires a deliberate integration choice is context propagation: passing the current trace ID and span ID to whatever service gets called next, so that service’s span gets created as a child of the right parent instead of starting a disconnected trace of its own.
In practice, this means an outgoing HTTP call needs a header like:
traceparent: 00-4bf92f3577b34da6a3ce929d0e0e4736-00f067aa0ba902b7-01which encodes the trace ID and current span ID per the W3C Trace Context spec. Most OpenTelemetry SDKs inject this automatically for HTTP clients they instrument, but it breaks silently at any boundary the SDK doesn’t know about: a message queue, a gRPC call using a library the SDK doesn’t wrap, or a call made through a raw socket. When a trace looks “broken” into unconnected fragments, the propagation step at exactly one hop is almost always where to look first.
Setting it up with OpenTelemetry
A minimal Node.js example, instrumenting an Express service:
const { NodeSDK } = require('@opentelemetry/sdk-node');
const { getNodeAutoInstrumentations } = require('@opentelemetry/auto-instrumentations-node');
const { OTLPTraceExporter } = require('@opentelemetry/exporter-trace-otlp-http');

const sdk = new NodeSDK({
  traceExporter: new OTLPTraceExporter({ url: 'http://localhost:4318/v1/traces' }),
  instrumentations: [getNodeAutoInstrumentations()],
});

sdk.start();
getNodeAutoInstrumentations() patches common libraries (Express, http, popular database clients) to generate spans and propagate context automatically. For anything the auto-instrumentation doesn’t cover, a manual span looks like:
const { trace } = require('@opentelemetry/api');
const tracer = trace.getTracer('orders-service');

async function createOrder(payload) {
  return tracer.startActiveSpan('orders: create order', async (span) => {
    try {
      const result = await db.orders.insert(payload);
      return result;
    } finally {
      span.end();
    }
  });
}
The exporter sends completed spans to a backend, Jaeger, Grafana Tempo, Honeycomb, or a vendor’s hosted product, over the OTLP protocol. Because OpenTelemetry decouples instrumentation from backend, switching which backend receives those spans later is a configuration change, not a re-instrumentation project.
Tracing versus logging versus metrics
These three answer genuinely different questions, and teams that set up only one of them tend to hit a wall the other two would have caught:
| Tool | Answers | Doesn’t answer |
|---|---|---|
| Metrics | Is the system healthy right now, in aggregate? | Which specific request was slow, and why? |
| Logs | What happened inside one service? | How did that fit into the rest of the request across services? |
| Traces | Which specific hop, in which specific request, caused the slowness? | Broad health trends across thousands of requests (better suited to metrics) |
A trace that shows payments: charge card as the long pole in a slow checkout still benefits from that service’s own logs to explain why the charge took 260ms, a downstream card network timeout, a retry, a lock wait. Tracing narrows down where to look; logs and metrics fill in what happened there.
When it’s actually worth the setup cost
Below two or three services in a request’s path, tracing is usually more infrastructure than the problem calls for; solid logging covers most of what a trace would tell you. The value curve bends sharply once a request routinely crosses three or more service boundaries and a slow response could plausibly originate at any of them, similar to how reasoning about failure isolation with circuit breakers only pays off once one slow dependency can actually take others down with it. At that point, the alternative to a trace isn’t “no debugging effort,” it’s manually correlating timestamps across five sets of logs by hand, which takes real engineering time on every single incident instead of a one-time setup cost paid once.
If a team is already running microservices and still triaging cross-service latency by opening five log dashboards side by side, that’s the concrete signal that tracing has been overdue for a while, not a nice-to-have for later.
Frequently asked questions
- What is distributed tracing?
- It's a technique for tracking a single request as it moves through multiple services, by tagging every operation involved with a shared trace ID. Each operation is recorded as a span, with its own start time and duration, and spans are linked together by parent-child relationships that mirror which call triggered which. The result is a single, queryable timeline of everything that happened to satisfy one request, across every service boundary it crossed.
- What's the difference between a trace and a span?
- A trace is the entire end-to-end journey of one request, identified by a single trace ID. A span is one unit of work inside that trace, an HTTP call, a database query, a cache lookup, each with its own start time, duration, and a parent span ID pointing to whatever span triggered it. A trace with five services involved typically has at least five spans, often more if any service makes multiple internal calls.
- Why does distributed tracing require code changes, unlike some monitoring?
- Context propagation is the part that can't be added purely at the infrastructure layer for most stacks. When service A calls service B, A has to pass its trace ID and current span ID to B, usually via an HTTP header like traceparent, so B can create its own span as a child of A's. Without that handoff, B has no way to know which trace it's part of, and its work shows up as a disconnected fragment instead of a connected step in the same request.
- What is OpenTelemetry and do I need it specifically?
- OpenTelemetry is a vendor-neutral standard and set of SDKs for generating traces, metrics, and logs. You don't strictly need it, some observability vendors ship their own proprietary instrumentation, but using it means your instrumentation code doesn't have to change if you switch from one tracing backend (Jaeger, Datadog, Honeycomb, Grafana Tempo) to another. Given how often teams re-evaluate observability vendors, that portability is usually worth the small amount of extra setup.
- Is distributed tracing worth setting up for a small system?
- If a request only ever touches one or two services, probably not yet; good logging usually answers the same questions. The value shows up specifically at the point where a request routinely crosses three or more service boundaries and a slow request could plausibly be caused by any of them. That's the threshold where guessing from logs alone starts costing real debugging time, and a trace turns a multi-hour investigation into a five-minute read of one waterfall view.
Sources
Sponsored
More from this category
More from Cloud & Infrastructure
 R.01
R.01 Leader Election Explained: How a Cluster Picks Who's in Charge
 R.02
R.02 Structured Logging Done Right: JSON, Correlation IDs, and What to Skip
 R.03
R.03 How Database Indexes Actually Work (And When They Make Queries Slower)
Sponsored
Discussion
Join the conversation.
Comments are powered by GitHub Discussions. Sign in with your GitHub account to leave a comment.
Sponsored