Web Development · Performance
How to Debug a Memory Leak in Production Node.js: Heap Snapshots, Step by Step
Your Node process's memory climbs until it gets OOM-killed, and restarting just buys a few hours. Here's the actual workflow for finding what's leaking: heap snapshot comparison, retainer paths, and the tools that make it fast.

Abhishek Gupta
6 min read
Sponsored
The process starts at 200MB, climbs steadily for six hours, and gets OOM-killed by the orchestrator right as your on-call gets paged. You restart it, memory resets to 200MB, and the climb starts again. That cycle is the signature of a memory leak, and the fix isn’t a bigger container, it’s finding the object that’s being kept alive when it shouldn’t be.
Confirm it’s actually a leak first
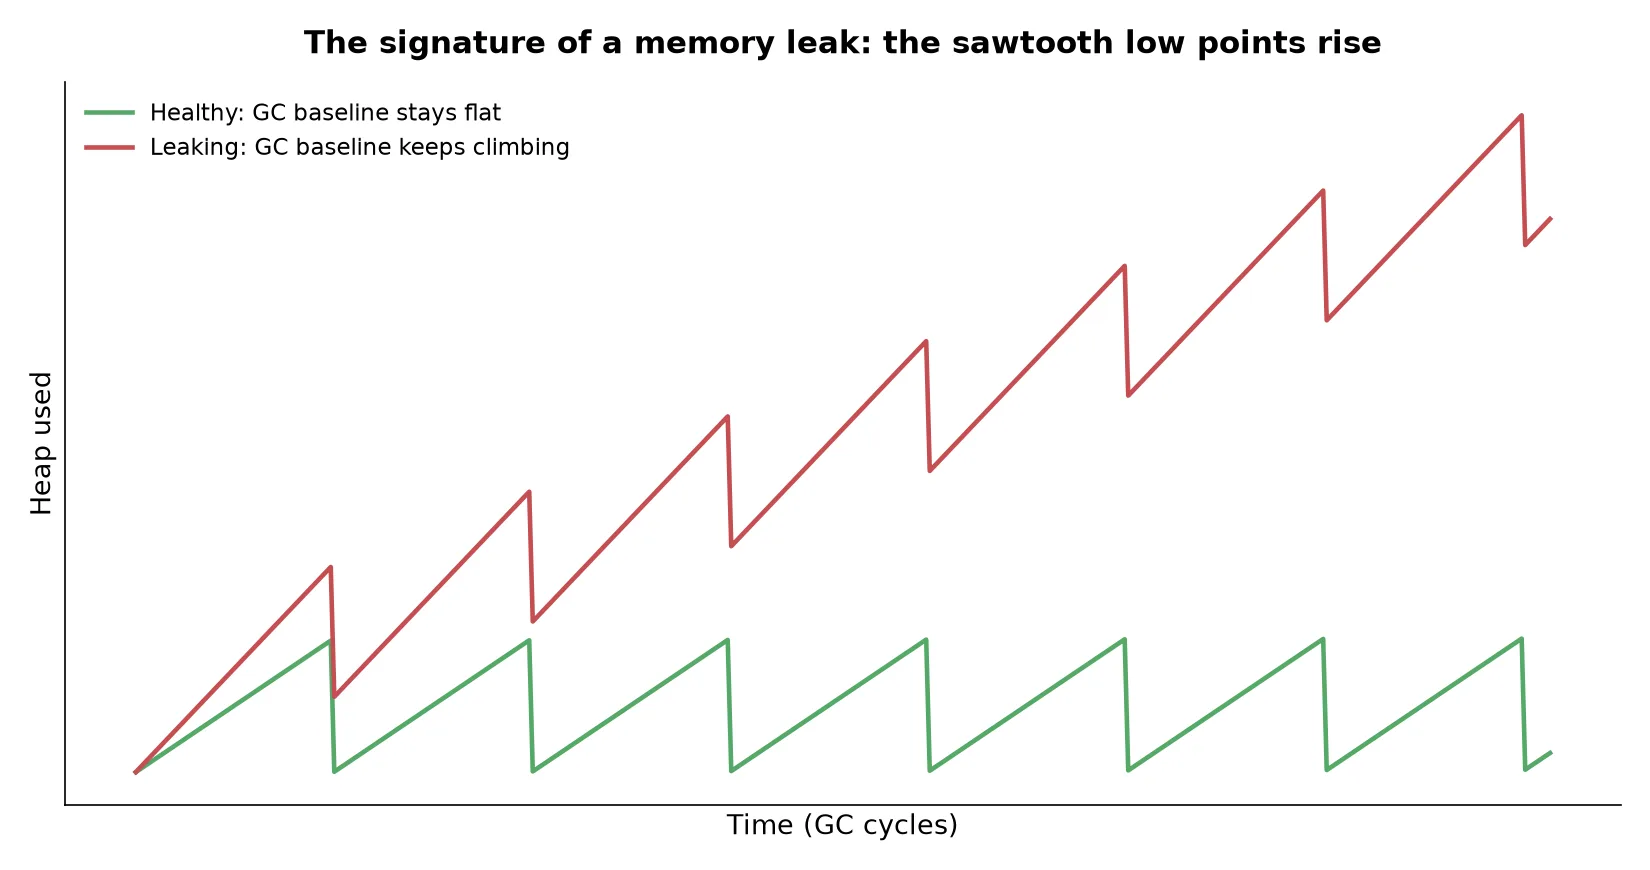
Node’s garbage collector runs on its own schedule, and process memory naturally saws up and down as objects get allocated and reclaimed. A single memory graph that looks alarming over five minutes is often just normal GC behavior. What you’re looking for is the trend across many GC cycles: does the low point after each collection keep rising, or does it return to roughly the same baseline every time?
// A crude but effective first check: log heap usage every 30s
setInterval(() => {
  const { heapUsed, rss } = process.memoryUsage();
  console.log(`heapUsed=${(heapUsed / 1024 / 1024).toFixed(1)}MB rss=${(rss / 1024 / 1024).toFixed(1)}MB`);
}, 30_000);
Pipe that into whatever you already use for metrics and look at it over hours, not minutes. If the RSS baseline is flat and only the peaks vary with traffic, you don’t have a leak, you have normal allocation pressure that might warrant tuning GC settings, but that’s a different problem. If the baseline itself is climbing, keep going.
Capture two heap snapshots and diff them
This is the actual technique, and it’s less mysterious than it sounds. Start the process with the inspector enabled:
node --inspect app.jsOpen chrome://inspect in Chrome, connect to the process, and go to the Memory tab. Take a heap snapshot right after startup or after a known-good state, let the app run under real or simulated load for several minutes, then take a second snapshot. Switch the Memory tab to Comparison mode and sort by # Delta or Alloc. Size descending.
What you’re looking for is object types with a large positive delta between the two snapshots, meaning a lot more instances exist in the second snapshot than the first, and that are still retained (Chrome DevTools shows the total retained size for the count difference). If you see Closure or Array or a specific class you defined growing by thousands of instances between two snapshots taken five minutes apart under steady traffic, that’s your leak candidate.
Click into one of the retained objects and DevTools shows a retainer chain, the path of references keeping that object alive. That chain is the answer to “why isn’t this getting garbage collected”: somewhere in that chain is a reference you didn’t mean to keep around.
The three usual suspects
Almost every Node memory leak traces back to one of these patterns.
Event listeners that accumulate. This is the most common one by a wide margin.
// Leaks: a new listener is added on every request and never removed
app.get("/data", (req, res) => {
  eventBus.on("update", (data) => res.json(data)); // never removed
});
Every request adds a new listener to eventBus that outlives the request itself. After a few thousand requests, eventBus is holding thousands of closures, each one keeping its own res object (and everything res closes over) alive. Node will even warn you about this specific case with a MaxListenersExceededWarning once you cross the default limit of 10, which is a free signal worth paying attention to rather than silencing.
// Fixed: listener is scoped to the request and removed when done
app.get("/data", (req, res) => {
  const handler = (data) => res.json(data);
  eventBus.once("update", handler);
  req.on("close", () => eventBus.removeListener("update", handler));
});
Closures capturing more than they need. A closure keeps everything in its enclosing scope alive for as long as the closure itself is reachable, not just the variables it actually uses.
function processLargeDataset(hugeArray) {
  const summary = hugeArray.length;
  // This closure captures hugeArray in scope even though it only uses `summary`
  return () => `Processed ${summary} items`;
}
If the function returned here gets stored somewhere long-lived, a cache, a queue, a module-level array, hugeArray stays in memory for as long as that closure does, even though nothing in the closure body references it directly. The fix is usually to extract only the primitive values you need before returning the closure, so the large object isn’t reachable through it.
Unbounded caches. An in-memory Map or plain object used as a cache with no eviction policy will grow forever if the key space is unbounded, which is more common than it sounds: caching by user ID, by request path with query params, or by any value that isn’t drawn from a small fixed set.
// Grows without limit; each unique key stays forever
const cache = new Map();
function getCached(key, compute) {
  if (!cache.has(key)) cache.set(key, compute());
  return cache.get(key);
}
Swap it for an LRU cache with a hard size cap (the lru-cache package is the standard choice) or add a TTL and periodic sweep if staleness matters more than size.
Tools that speed up the first pass
Chrome DevTools’ Memory tab is enough for most cases, but two tools are worth having in the toolbox for a faster first look:
| Tool | What it’s good for |
|---|---|
Clinic.js (clinic heapprofiler) | Runs your app under load and produces a flame graph of allocations, useful for spotting which function is doing the allocating before you dive into snapshot diffing |
| 0x | Focused CPU flame graphs; less useful for memory specifically but good for correlating a leak with a hot code path |
| heapdump module | Lets you trigger a snapshot via a signal handler in a running production process, without an attached debugger session |
npm install -g clinic
clinic heapprofiler -- node app.js
# hit the app with load (autocannon, k6, or real traffic), then Ctrl+C
# clinic opens an interactive flame graph in your browser
Fix the retainer, not the symptom
It’s tempting to reach for --max-old-space-size to buy headroom, or to add a scheduled restart to reset memory before the OOM kill happens. Both are reasonable stopgaps while you’re actively debugging, the same way a circuit breaker buys you time during an incident without being the actual fix. Neither one removes the reference that’s keeping the leaking object alive, which means the underlying growth rate is unchanged, and you’ve just moved the crash further out or made it less frequent.
The snapshot-diff workflow above will point you at the specific retainer chain in nearly every case. Once you can see what’s holding the reference, the fix is usually a few lines: remove a listener, narrow a closure, or cap a cache. The hard part is finding it, not fixing it, which is exactly what two snapshots five minutes apart are for.
Frequently asked questions
- How do I know if I actually have a memory leak versus normal memory growth?
- Graph RSS or heap usage over several garbage collection cycles, not just a few minutes. Normal Node processes grow, garbage collect, and drop back down in a sawtooth pattern. A leak looks like the sawtooth's low points climbing over time: each GC cycle reclaims less than the process allocated since the last one, so the baseline keeps rising even when traffic is flat.
- What's the fastest way to capture a heap snapshot in production without restarting the process?
- Send the process a USR2 signal if you've wired up the heapdump module, or connect Chrome DevTools to a running process started with --inspect (or attach after the fact via --inspect-brk on a SIGUSR1 in newer Node versions) and trigger a snapshot from the Memory tab. Both avoid a restart, though attaching an inspector to a live production process still carries a brief latency cost while the snapshot is taken, so time it for a lower-traffic window if you can.
- What are the most common causes of Node.js memory leaks?
- Event listeners registered on a long-lived emitter (like an HTTP server or a shared EventEmitter) and never removed, especially inside a function that runs on every request. Closures that capture a large object in scope and get stored somewhere long-lived, like a cache or a queue. And unbounded in-memory caches, arrays, or Maps that grow with usage but have no eviction policy.
- Do I need a heap snapshot, or can I just watch process.memoryUsage()?
- process.memoryUsage() tells you that memory is growing but not why. It's the right first signal, wire it into your monitoring and alert on a sustained upward trend, but once you've confirmed a leak exists, you need heap snapshots to see which object types are accumulating and what's still holding a reference to them.
Sources
Sponsored
More from this category
More from Web Development
 R.01
R.01 Webhook Design: Signatures, Retries, and Idempotency Done Right
 R.02
R.02 Node.js Is Moving to One Major Release a Year. What That Means for Your Upgrade Plan
 R.03
R.03 WebMCP: How Chrome Lets a Website Expose Its Own Tools to AI Agents
Sponsored
Discussion
Join the conversation.
Comments are powered by GitHub Discussions. Sign in with your GitHub account to leave a comment.
Sponsored