Business · Engineering Leadership
DORA Metrics Explained: The Four Numbers That Actually Predict Team Performance
Deployment frequency, lead time for changes, change failure rate, and time to restore service. Here's what each DORA metric actually measures, the performance tiers that separate elite teams from the rest, and where teams misuse them.

Anurag Verma
5 min read
Sponsored
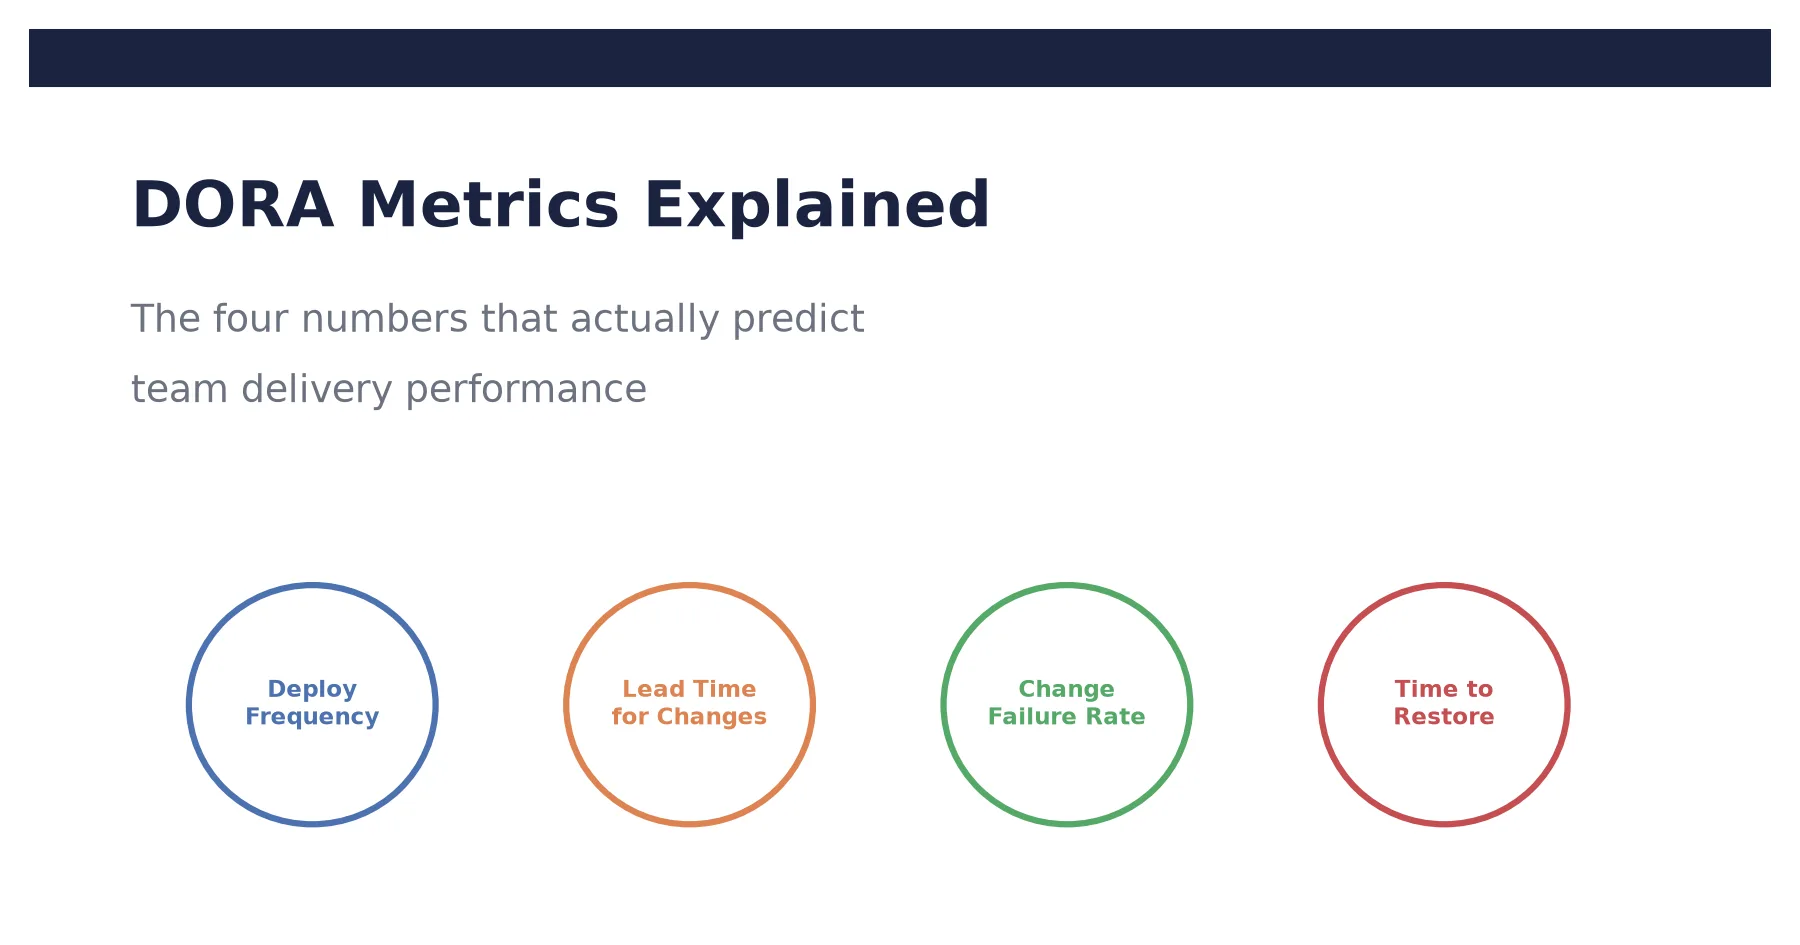
Ask ten engineering leaders how their team is performing and you’ll get ten different answers built on ten different gut feelings. DORA’s four metrics exist to replace that gut feeling with something you can actually measure: deployment frequency, lead time for changes, change failure rate, and time to restore service. They came out of years of research by the DevOps Research and Assessment program correlating specific practices with measurable outcomes, and they’re still the closest thing the industry has to a standard answer to “is our engineering team actually good at shipping software.”
Here’s what each one measures, what counts as strong performance, and where teams misuse them badly enough to make the metrics actively harmful.
The four metrics, defined precisely
Deployment frequency measures how often a team successfully releases to production. On-demand or multiple-times-a-day deployment is the top tier; monthly or less frequent releases sit at the bottom.
Lead time for changes is the median time between a commit landing and that commit running in production. Under a day is elite; anywhere from one to six months signals a slow, heavyweight release process.
Change failure rate is the percentage of deployments that cause a failure in production requiring a fix, expressed simply: four deployments in a day, one causes an incident, that’s a 25% change failure rate for that day.
Time to restore service is the median time between a deployment causing a failure and that failure being remediated, with remediation typically measured by an incident or bug report closing. Under an hour is elite; anything stretching toward months indicates either poor incident response or a codebase where root-causing failures is genuinely hard.
| Metric | Elite | Common warning zone |
|---|---|---|
| Deployment frequency | On-demand, multiple per day | Monthly or less |
| Lead time for changes | Under 1 day | 1-6 months |
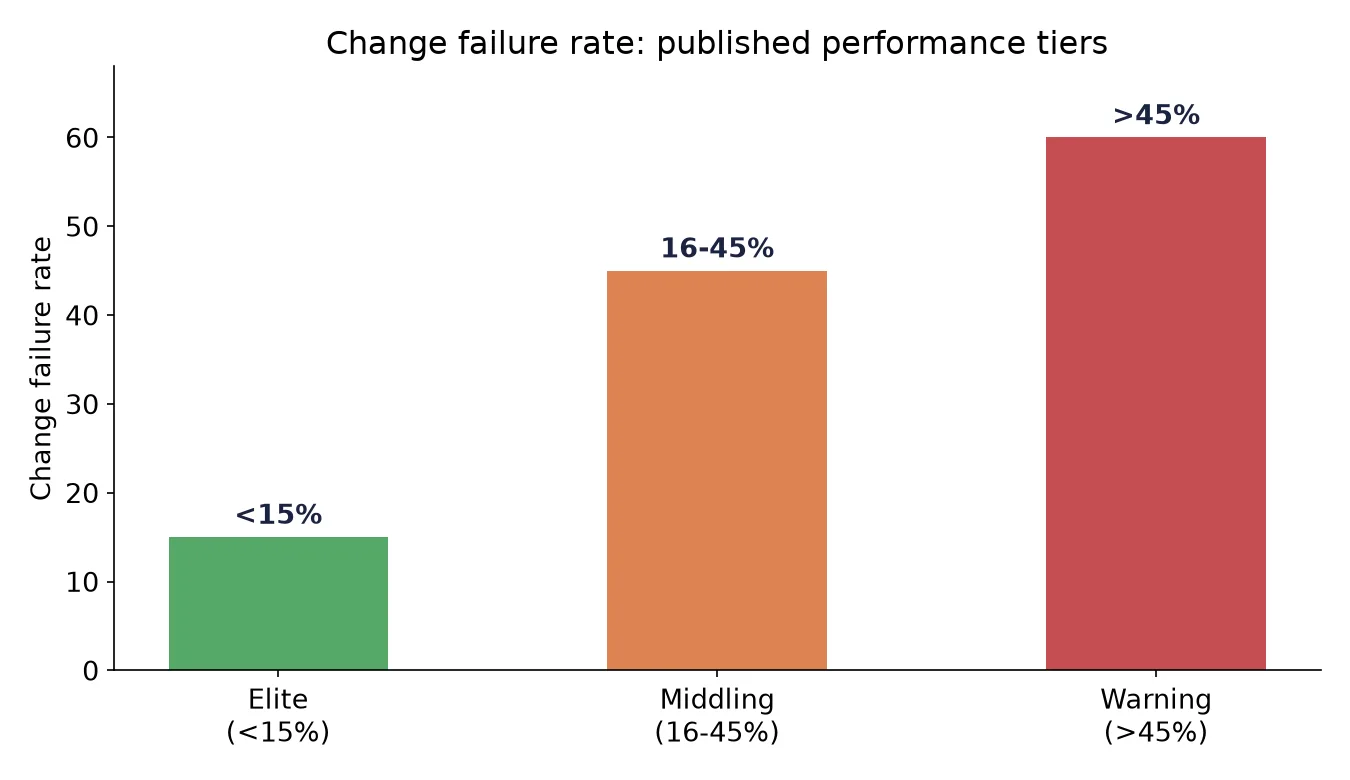
| Change failure rate | Under 15% | Over 45% |
| Time to restore service | Under 1 hour | Weeks to months |
Why they’re split into two pairs
Deployment frequency and lead time measure throughput: how fast code moves. Change failure rate and time to restore measure stability: what happens when something goes wrong. The reason DORA insists on tracking all four together instead of picking a favorite is that throughput and stability trade off against each other in the naive version of either goal.
A team optimizing only for throughput ships constantly and breaks things constantly, because nobody’s tracking whether the speed is coming at the cost of quality. A team optimizing only for stability moves glacially, wrapping every change in enough process to make failure rare, at the cost of shipping anything meaningful on a useful timeline. DORA’s actual research finding, the one that makes the four metrics worth using together, is that elite teams don’t trade throughput for stability. They’re fast and stable at the same time, because the practices that produce speed, small changes, automated testing, fast feedback loops, are largely the same practices that produce stability. Slow, heavyweight release processes don’t buy safety; they just hide the same failure modes behind more ceremony.
Where teams misuse these metrics
The single most common failure mode is pointing DORA metrics at individuals instead of the pipeline. These four numbers describe how code moves through a team’s delivery system as a whole, from commit to production and back through incident response. They were never designed to rank developers against each other, and doing it anyway creates exactly the incentives you’d expect: engineers batch commits to inflate deployment frequency numbers, avoid touching risky-but-necessary parts of the codebase to protect a personal change failure rate, or quietly redefine what counts as an “incident” to keep their numbers clean. The moment a metric becomes a personal score, people optimize the score instead of the underlying thing it was measuring.
The second failure mode is treating a strong scorecard as proof the team is doing the right work. All four metrics describe delivery performance, not product judgment. A team can hit elite tier on every number while structured incorrectly for what the product actually needs, shipping fast, reliable increments of a feature nobody asked for. The metrics answer “can this team deliver software well,” which is a real and useful question, but it’s a different question from “is this team building the right software,” and no amount of deployment frequency answers the second one.
Using them as a diagnostic, not a scorecard
The practical value of these four metrics is as a starting point for a specific conversation, not an end state to report upward. A high change failure rate paired with a long time to restore points at weak testing and weak observability, not a team that needs to be told to “be more careful.” A low deployment frequency paired with a short lead time often means the pipeline works fine but release cadence is a policy choice, not a technical limitation, worth revisiting separately from anything about engineering capability.
If your team already runs blue-green or canary deployments, you likely have most of the plumbing needed to track deployment frequency and change failure rate automatically from your CI/CD pipeline rather than self-reporting them, which removes the temptation to fudge the numbers before anyone sees them. Track all four together, treat a weak number as a question about the pipeline rather than a verdict on the people running it, and the metrics do what they were built for: turning “I think we ship pretty well” into something you can actually check.
Frequently asked questions
- What are the four DORA metrics?
- Deployment frequency (how often a team ships to production), lead time for changes (the median time from a commit landing to it running in production), change failure rate (the percentage of deployments that cause a production failure requiring a fix), and time to restore service (the median time to recover once a deployment causes an incident).
- What change failure rate counts as good?
- Under 15% is generally considered strong performance. 16 to 45% sits in a middling range that's common but worth investigating. Above 45%, meaning nearly half of deployments cause a problem, points to a real issue in testing, review, or deployment practices rather than normal variance.
- Why do these four metrics specifically, and not others?
- They came out of DORA's multi-year research program correlating specific engineering practices against measurable organizational outcomes, not a list someone assembled from intuition. The research consistently found that teams strong on all four outperformed teams strong on only one or two, which is why the metrics are meant to be read as a set rather than optimized individually.
- Can I use DORA metrics to evaluate individual developers?
- You shouldn't. The four metrics describe a team's or an organization's delivery pipeline as a whole: how code moves from commit to production and how the team responds when something breaks. Attaching them to individual performance reviews creates an incentive to game the numbers, batching commits to inflate deployment frequency, or avoiding risky-but-necessary changes to keep a personal failure rate low, instead of actually improving the pipeline.
- What don't DORA metrics measure?
- Whether the thing you shipped was the right thing to build. All four metrics describe delivery performance, how fast and how reliably code moves from a developer's machine to production, not product judgment. A team can have excellent DORA numbers while shipping features nobody uses, and a team with mediocre DORA numbers can occasionally still ship something that matters. They're a diagnostic for the delivery pipeline, not a scorecard for the roadmap.
Sources
Sponsored
More from this category
More from Business
 R.01
R.01 How to Hire an Embedded Firmware Engineer in 2026
 R.02
R.02 The 2026 Developer Rate Split: Junior Rates Are Falling, Senior Rates Are Climbing
 R.03
R.03 Oracle Is Borrowing Tens of Billions for AI Data Centers. What That Means If You Build on OCI.
Sponsored
Discussion
Join the conversation.
Comments are powered by GitHub Discussions. Sign in with your GitHub account to leave a comment.
Sponsored